Streams that contain a mixture of hydrocarbons frequently are represented by laboratory assay data. The assay data typically is in the form of TBP, ASTM D86, ASTM D1160, or ASTM D2887 distillation curves. Ultimately, this information is used by PRO/II to produce one or more sets of discrete pseudo-components that are used to model the behavior of each assay stream. This is described in fair detail in the PRO/II Reference Manual, Volume I, Chapter 1, under the heading Assay Processing. All these curves can be demonstrated by running any standard problem containing assay data.
The Distillation Curve provides the capability to display plots and tables of distillation curves for a selected stream.
To activate this:
Set the focus on a stream on the PFD, then
From the Tools menu, click the Distillation Curve item.
Alternatively, add the Distillation Hot Key button to the tool bar:
From the View menu, click the Toolbar item to display the Toolbar Customization DEW.
Highlight Distillation Curve in the Available Items: list box
Click the Add button to move Distillation Curve to the Selected Items: list box.
Click the OK button to confirm the change.
Now set the focus on a stream on the PFD,
and simply click the toolbar icon. ![]()
When the Stream Distillation Curves dialog that opens is shown in the figure.
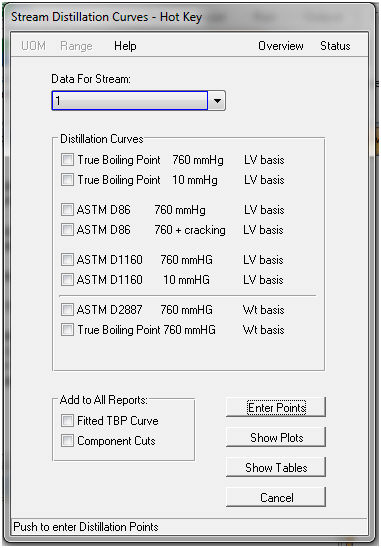
Data for Stream:
The ID of the selected stream (if any) appears in the Data for Stream: field. The Data for Stream: field is a drop-down list box that allows selecting a different stream. Choosing an initial stream without the assay attribute is invalid, and an error dialog displays this condition.
When no stream was initially selected, the Data for Stream: widget is bordered in red until a stream is chosen from the drop-down list. When populating the list of available streams, each stream is tested so only streams having assay data appear in the list.
Thermodynamic Method:
Use this drop down list box to specify the thermodynamic method set used to generate curve properties.
Distillation Curves
Once a valid stream is selected, select one or more of the curves listed in this group box by marking the respective check boxes. At least one curve must be selected.
Add to All Reports
Any items in this group box may be selected in addition to the curves specified in the Distillation Curves group box.
Fitted TBP Curve Each distillation curve is converted to a TBP curve at 760 mmHg before being cut into pseudo-components. Checking this option adds the resulting TBP curve to the display for each distillation curve.
Component Cuts This option displays the final component cuts derived from the fitted TBP curve for each distillation curve.
Enter Points Button
Pressing this button opens a window with default percent distilled data and can modify the percent distilled data points at which the TBP and ASTM distillation data has to be plotted.
Show Plots Button
Pressing this button initiates calculations for all the selected curves. A separate plot is generated for each selected curve. All options checked in the Add to All Reports group are added to every generated plot. Selecting these additional options is the only way to generate multiple curves on a single plot.
Each plot includes:
A title that identifies the type of distillation curve being plotted, and the stream to which the plot applies.
The horizontal X axis indicates Percent Distilled (liquid volume or weight basis, as appropriate).
The vertical Y axis indicates temperature.
Typically, the distillation curve data appears as points (represented by "x's") that are not connected by lines.
The Fitted TBP Curve appears as a continuously drawn (smoothed) plot.
The Component Cuts appear as a segmented curve with each segment representing one component cut.
Since there are 8 possible curves, pressing the Show Plots button could generate as many as 8 separate plots. The plot windows are non-modal, which means the user may navigate among them at will.
Pressing the Show Plots button issues a warning when no curve in the Distillation Curves group is selected.
Show Tables Button
Pressing this button initiates calculations for all the selected distillation curves. A single report contains a separate table for each selected curve (unlike the plots option). The order of appearance of the tabular curves is the same order shown in the Distillation Curves group.
Note: The curves selected in the Add to All Reports group box do not appear in the table report.
When stream distillation curves are included in the general PRO/II Output Report (Output menu, Generate Text Report item), all the curves appear in a single table. A sample table may be found in the output report of Application Briefs problem R3R.